Dr Power BI Usage Guide
Improve the user experience of your reports

Use Dr. Power BI to quickly analyze and fix your Power BI report issues. Get suggestions related to Alignment, Formatting and other visual recommendations. Dr. Power BI provides you an in-depth overview of every report page and its visuals in details to reduce manual effort.
Power BI, a data visualization offering from Microsoft, aims to provide best in industry interactive visualizations and business intelligence capabilities with the tooling simple enough for power users to create their own reports and dashboards.
With the ease of use and high adoption come challenges with ensuring alignment of all reports to the best practices and standards defined by the enterprise. Dr. Power BI tool helps end users quickly review if the reports they have built aligns with corporate standards and if they provide a great user experience.
Business Scenario
Fortune 500 companies today generate and analyze huge amounts of data from their business operations. Most of them use Power BI as a tool to derive insights from data to enable data driven critical business decision making. Based on our experience working with multiple enterprise customers, we saw a consistent pattern of scaled adoption of Power BI report building leading to problems with governance, user experience, performance of reports, consistent use of brand guidelines and themes, using custom components, and ensuring the right architecture for the solutions.
Existing Process adopted by all our customers:
There are no major tools that provide recommendations and feedback on Power BI reports built by power users that covers all aspects of enterprise BI guidelines. In most cases, governance is a manual process and so is not scalable. This impacts user experience and increases costs to acquire additional capacity to maintain the reports.
Key Business Challenges:
- Reduce manual effort - Reduce the effort used in analyzing each page of the report.
- Improve accuracy of analysis - Build a solution for reliable and accurate analysis of reports.
- Provide actionable insights - Build a solution to analyze the report and provide suggestions on improvements that can be made to the report.
- Reduce cost – Reduce cost by optimizing DAX queries (Coming Soon)
We designed a tool to help capture multiple aspects of the implementation of Power BI reports.
These include:
- Alignment of visuals on each page of a report.
- Use of formatting pane options of visuals in all pages of a report.
- Choice of the number of visuals on report pages. Too many visuals on a page typically leads to increased page load time.
- DAX query optimization suggestions to perform calculations faster than ever (Coming soon).
- Identification of the use of custom visuals
- Other recommendations to reduce the page load time
Using Dr. Power BI
Developers can take advantage of the recommendations from the tool to improve the overall user experience of their reports.
Power BI tenant admins can inventory all the reports and workspaces they have in order to help them remove unused workspaces and manage the reporting assets.
-
Open the Dr. Power BI tool. Log into the tool using an Office 365 account which has the access to use the report.
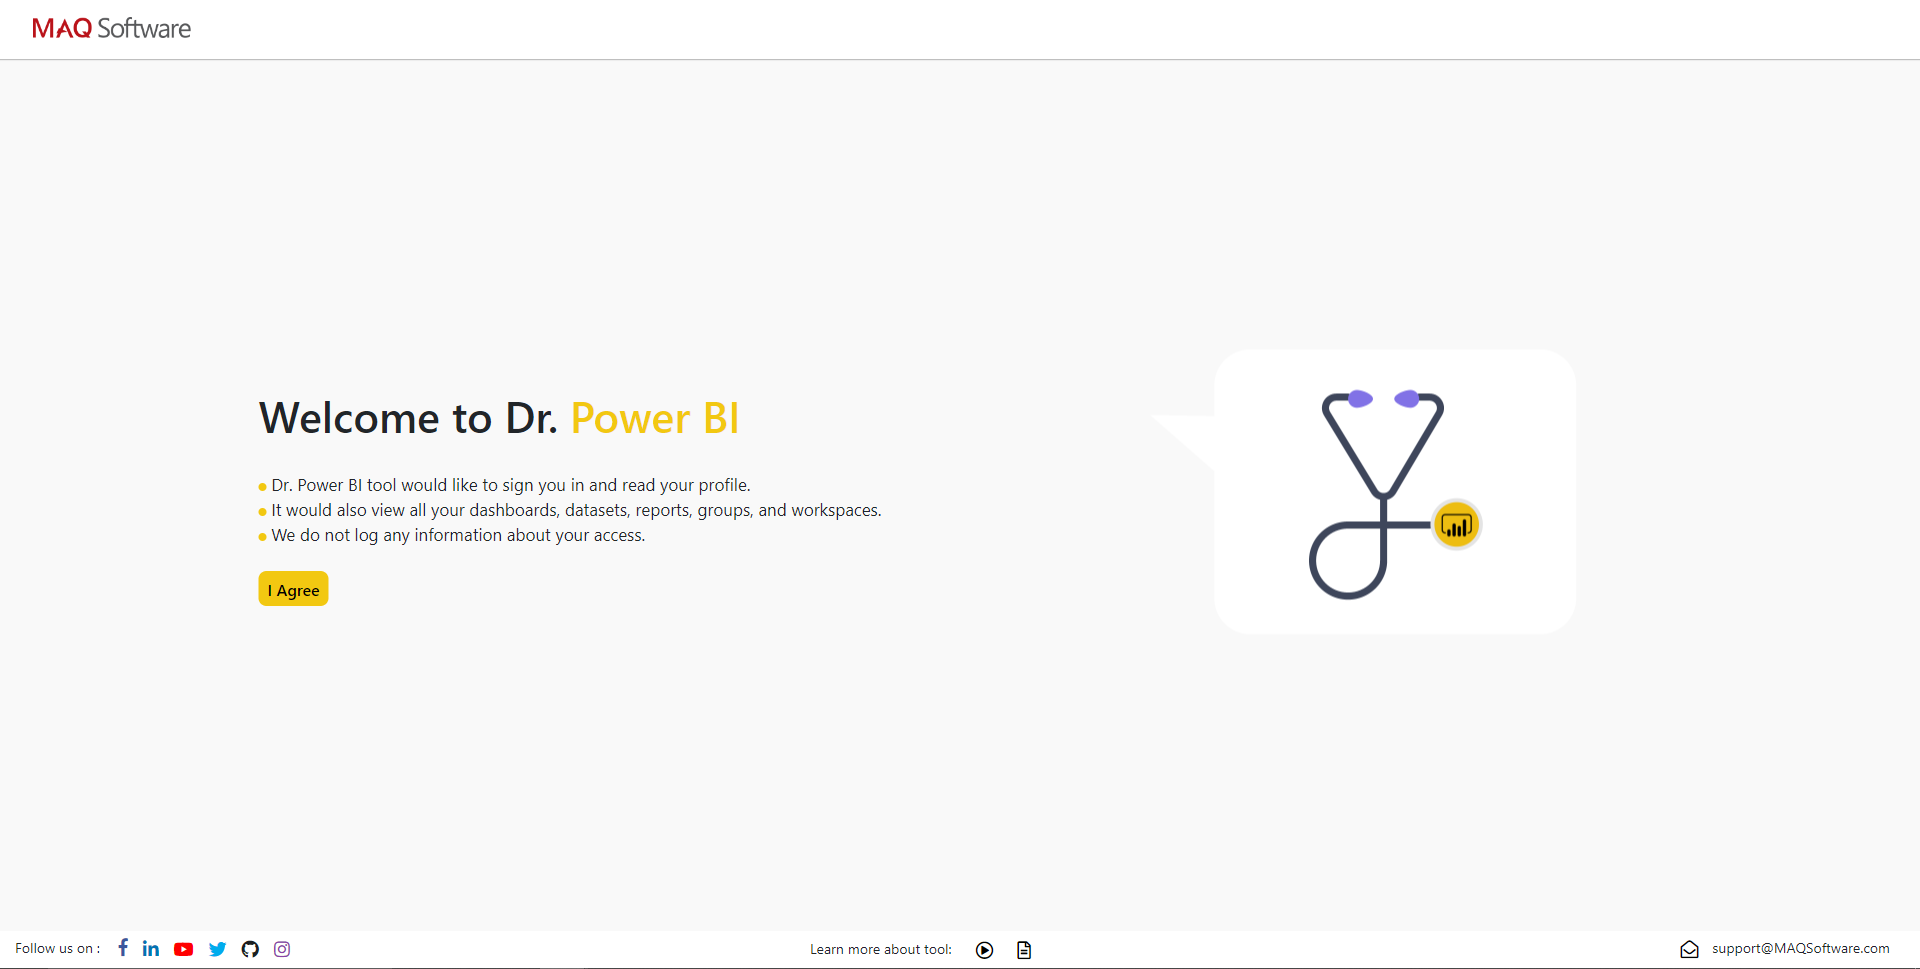 Figure 1: Landing page
-
Enter the report URL of the report hosted on the Power BI Service or upload the ‘pbix’ file. After successful entry of the report URL or file upload, you will be redirected to a “Know your report” page. This page has basic details about your report. Other tabs show additional details by pages of the report. The details are supplemented with a scoring system. A score below 30 is considered a good score.
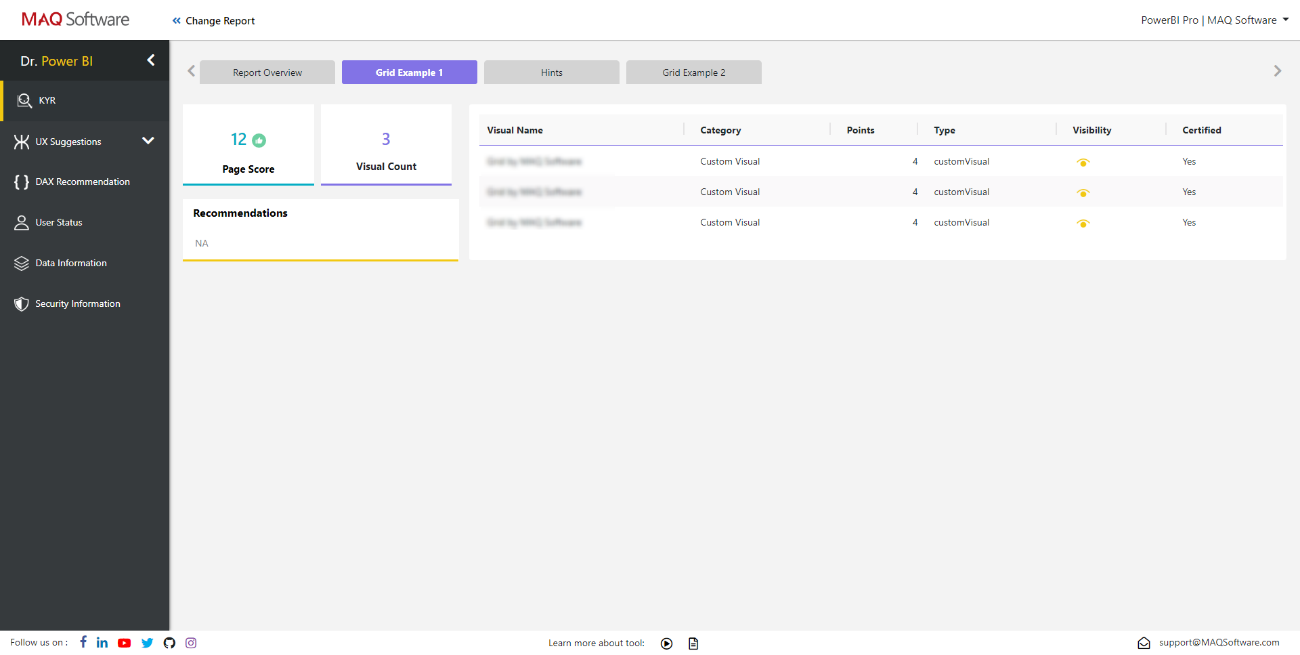 Figure 2: Know your report page
-
Use the left navigation pane to view UX suggestions such as:
-
Alignment: Click on an element’s margins and check its alignment with other elements. You may also enable additional options such as Dimensions, Co-ordinates and Grid Lines for suggestions for better visualization.
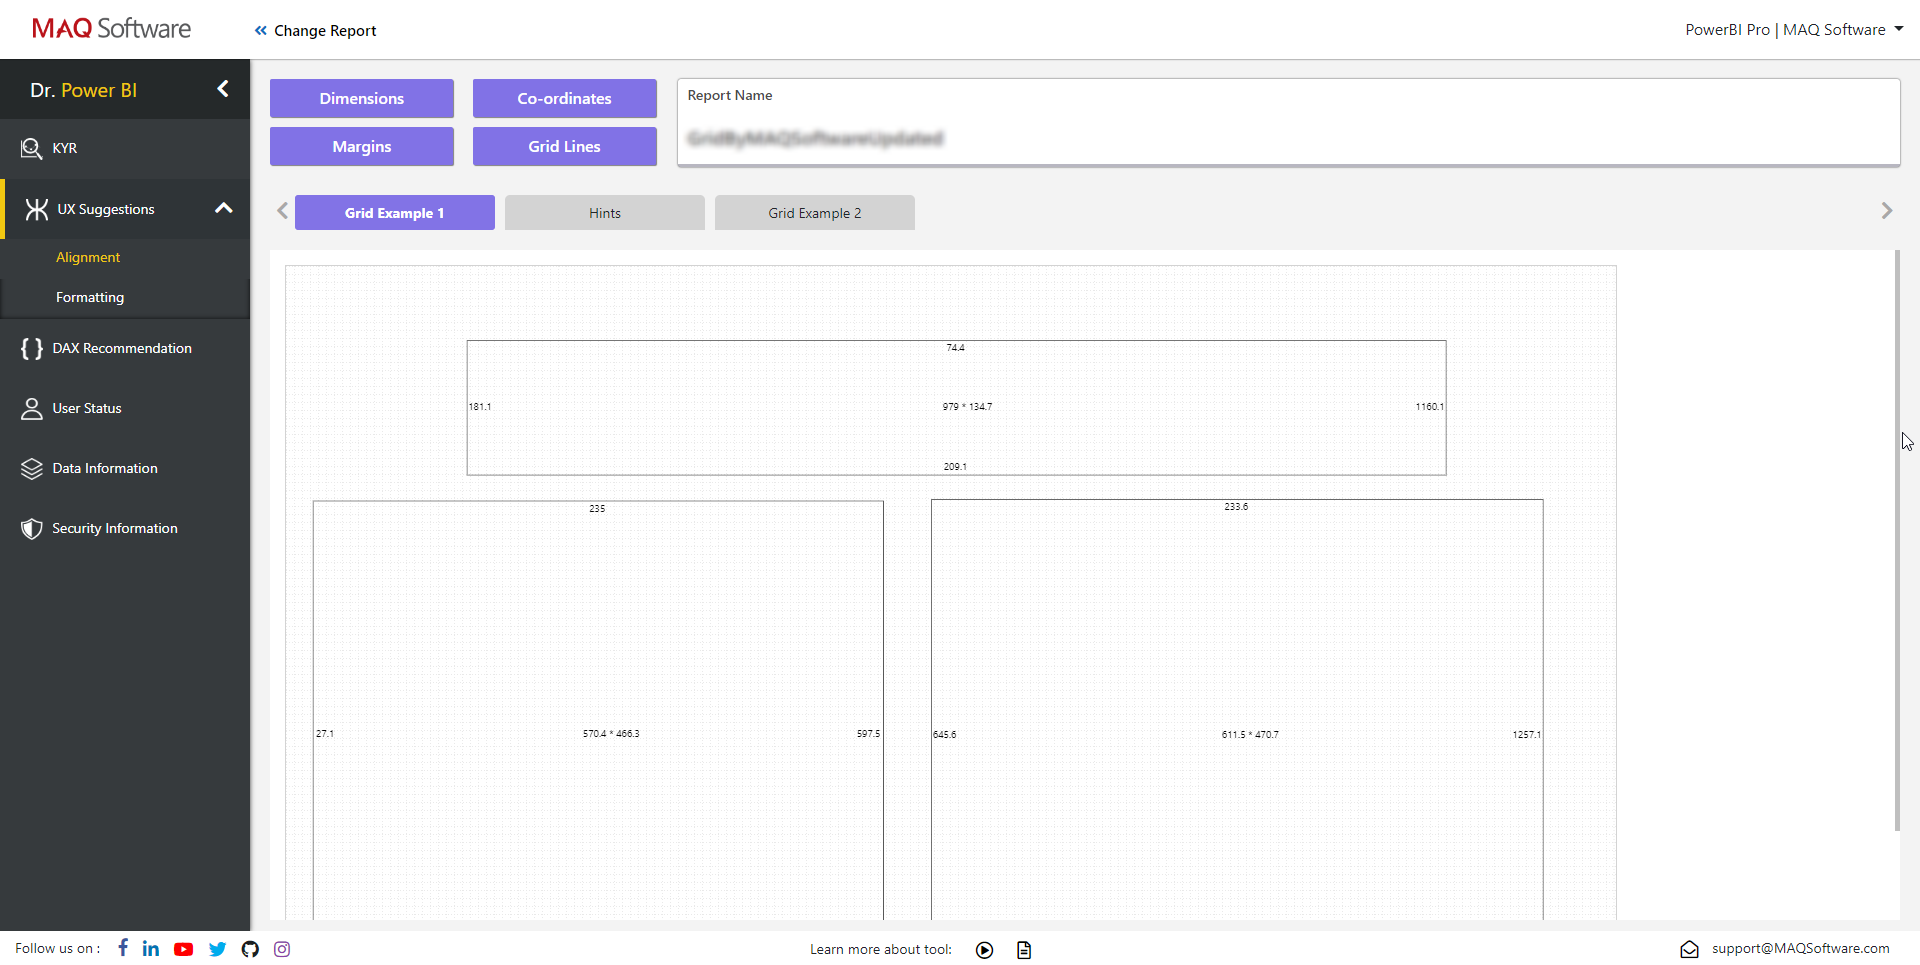 Figure 3: Alignment settings on the change report page
-
Formatting: Provides information about various fonts used on the page and offers suggestions based on formatting options set in the selected report page.
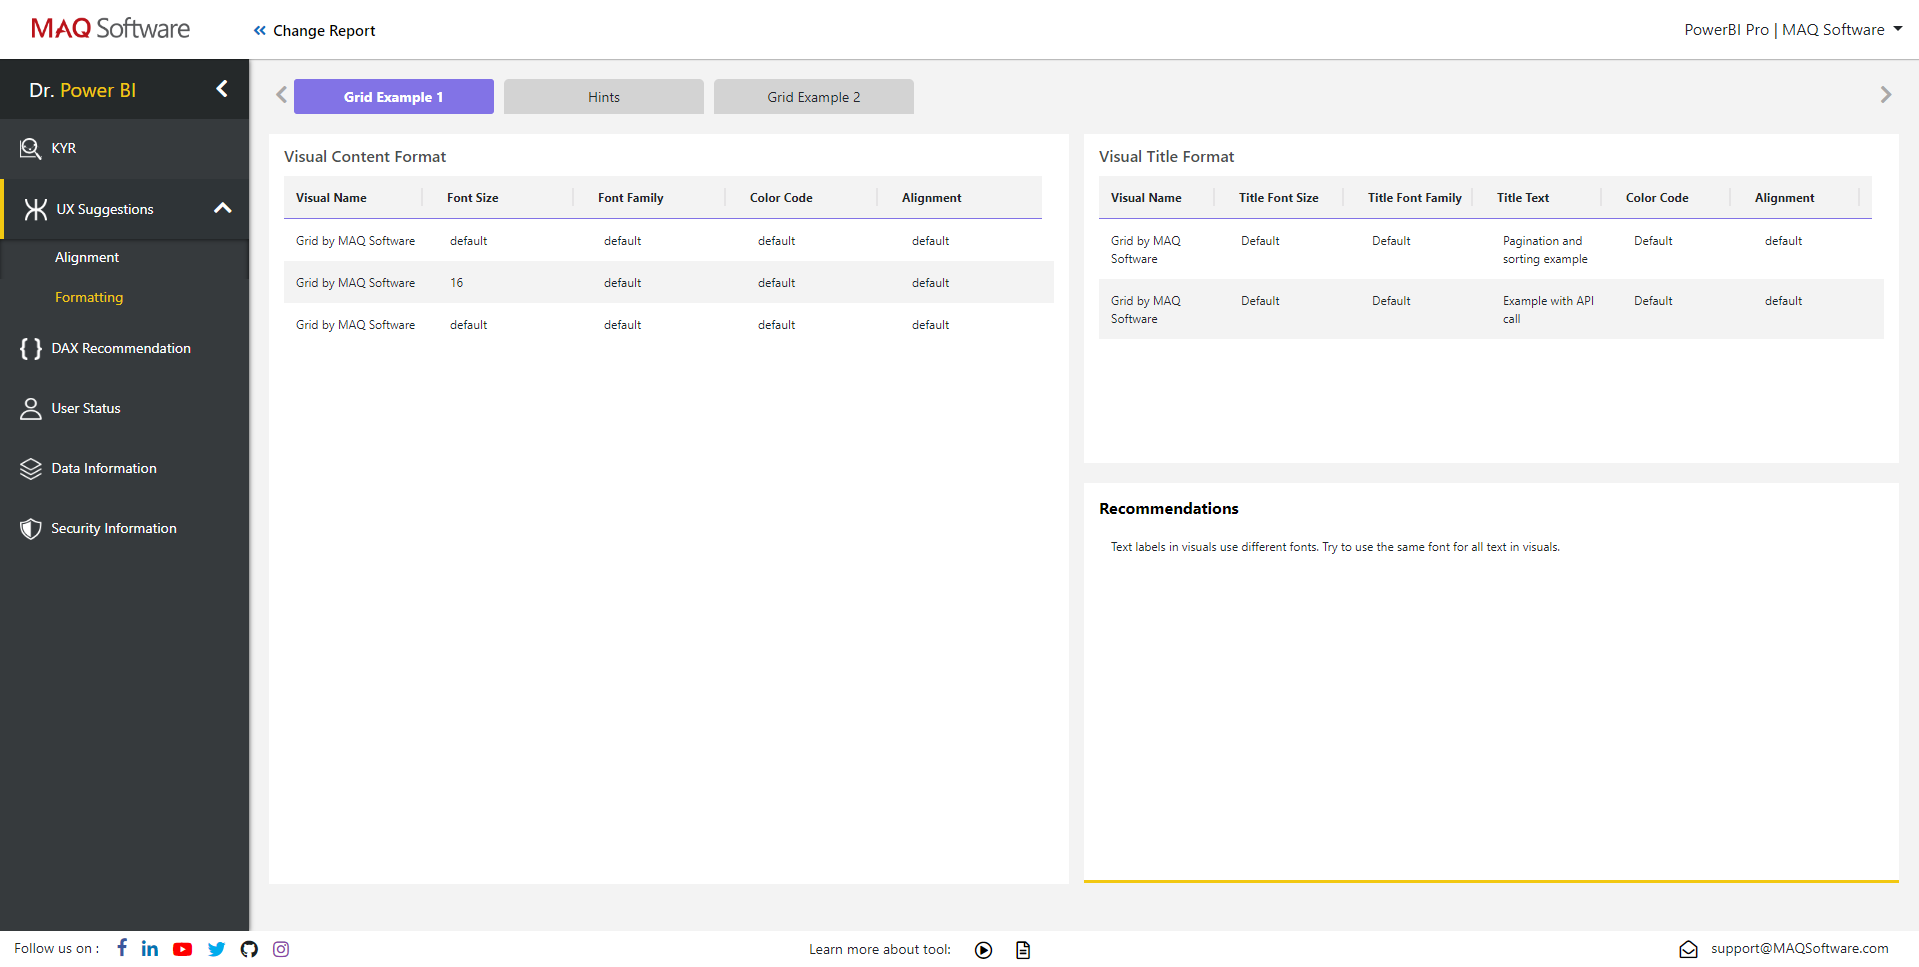 Figure 4: Formatting settings on the change report page
-
Alignment: Click on an element’s margins and check its alignment with other elements. You may also enable additional options such as Dimensions, Co-ordinates and Grid Lines for suggestions for better visualization.
- “DAX Recommendations” is a static list based on our experience in optimizing a wide range of reports built on a plethora of data sources.
- If you have provided a report URL from your Power BI service, you also get three additional options:
-
User status: Provides basic information of the Reports and Workspaces.
 Figure 5: User status page
-
Data information: Provides detailed information on the datasets, data sources and their refresh histories.
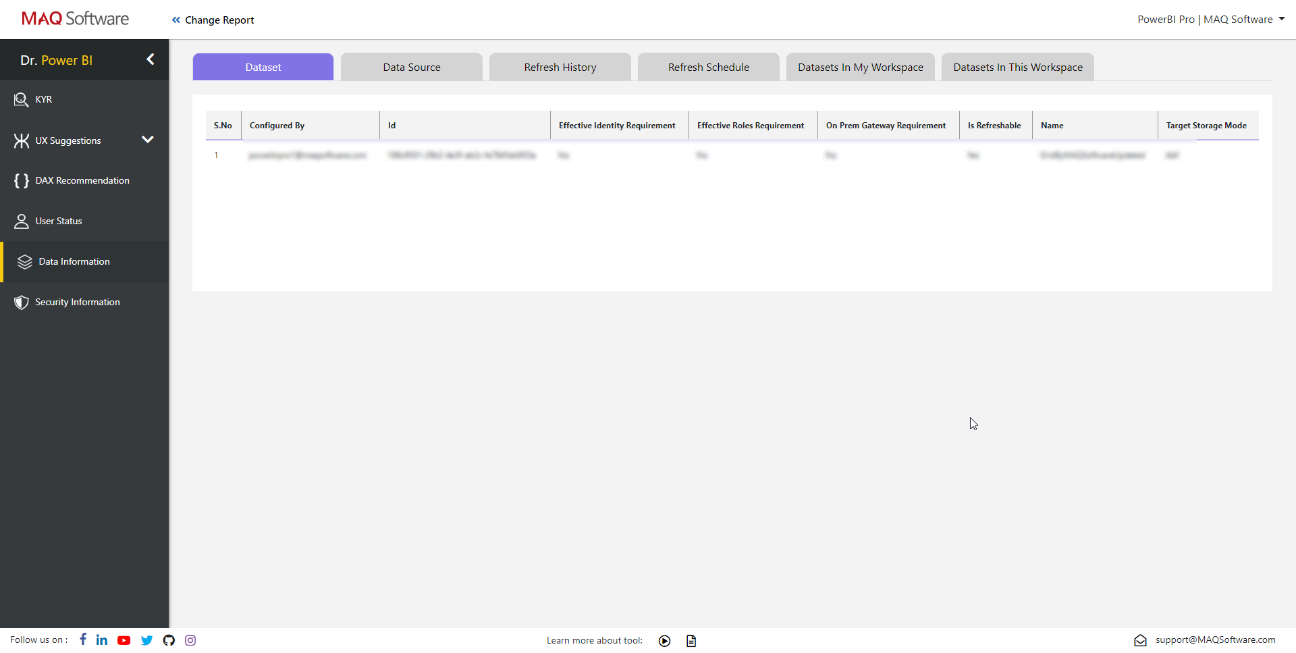 Figure 6: Data information page
-
Security Information: Provides information on the users and their access rights on the current workspace.
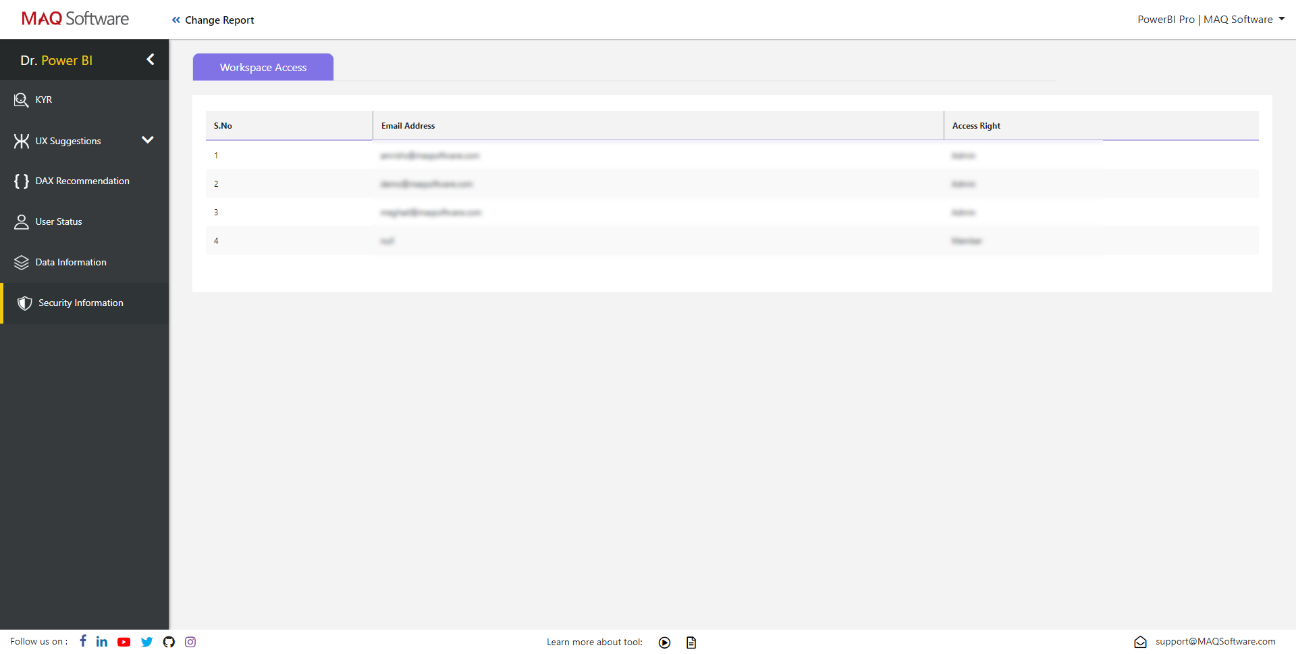 Figure 7: Security information page
Developers and tenant admins will be able to save time and get more done in less time using the Dr. Power BI tool.
Business Outcomes
- Saved efforts towards review and identification of opportunities to improve the user experience of the enterprise reports
- Improved governance in inventorying and managing the enterprise reporting assets
Learn More
To discuss customization and prices, please contact our sales team at Sales@MAQSoftware.com